Silver is the GO TO ASSET!
GNS+RESEARCH
LINK:http://srsroccoreport.com/important-charts-on-gold-silver-eagle-sales/important-charts-on-gold-silver-eagle-sales/
Important Charts On Gold & Silver Eagle Sales
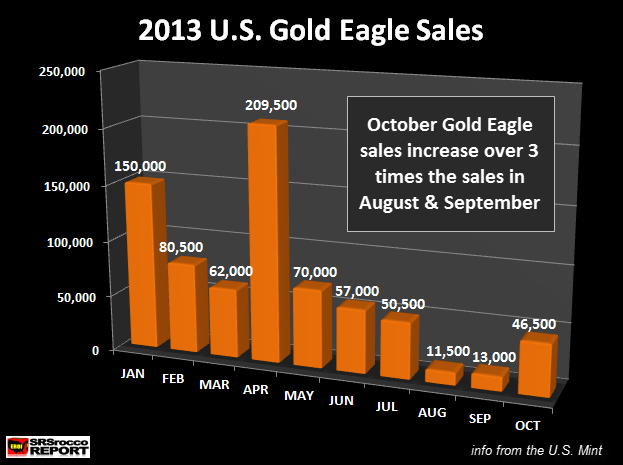
After the record buying of Gold Eagles after the precious metal smack-down in April of this year, sales of these coins declined significantly in August & September. However, sales have seen a substantial turn around this past month.Sales of the Gold Eagles were only 11,500 oz in August and 13,000 oz in September. The total of these two months were only half of the total amount shown in July, which recorded 50,500 oz of Gold Eagle sales
If we look at the chart below, we can see that Gold Eagle sales have increased to 46,500 oz, over 3 times the amount they were in the previous two months:
I don’t have an updated chart for the Silver Eagles, but their present October sales figures are 3,087,000 for a total of 39,175,000 for 2013. If we see another 3 million sales for each of the remaining two months of the year, total sales of Silver Eagles should reach a new record of 45 million in 2013.
Important Chart On Historic Silver-Gold Eagle Sales Ratio
To get a good idea of the interesting trend taking place in the Gold & Silver Eagle market, we need to go back and look at the historic sales data from the U.S. Mint.
Assuming current spot prices plus typical premiums, the total value of Gold Eagles sold to date would be approximately $28 billion and Silver Eagles $9 billion. Thus, we have a historic 3/1 value ratio. Basically, investors have bought $3 dollars of Gold Eagles compared to every $1 of Silver Eagles over the lifespan of the program.
Now If we break down the data further, we can see a very interesting trend.
You will notice from the start of the program in 1986, sales of Gold Eagles were much higher in percentage terms compared to Silver Eagles. From 1986-1995 sales of Gold Eagles were 6.3 million while Silver Eagles were 62 million. So, for the first ten years, the ratio of Gold to Silver Eagles was 10/1.
Furthermore, from 1996-2005 Gold Eagle sales were 7.2 million while Silver Eagle sales hit 76 million. Again, we had a little more than a 10/1 ratio during this ten-year time period.
However, something very interesting has taken place in the last 8 years. Sales of Gold Eagles are estimated to be 6.5 million from 2006-2013 whereas Silver Eagle sales will hit an astounding 222 million.
This turns out to be a staggering 34/1 ratio. In addition, the ratio will hit nearly 53/1 in 2013. This is based on an estimated 45 million Silver Eagles & 850,000 oz of Gold Eagles for 2013.
By extrapolating the data from 2006-2013, the value of total Gold Eagles sold is approximately $9.1 billion and Silver Eagles are $5.6 billion. Here we can see the value ratio is now less than 2/1 (1.6/1 to be exact).
Lastly, in 2013 the value ratio of Gold-Silver Eagles will fall to nearly 1/1. Using the same current spot price plus premiums, the total value of Gold Eagles sold in 2013 will be worth $1.19 billion and Silver Eagles $1.13 billion (based on estimated 850,000 oz Gold Eagles @ $1,400 and 45 million Silver Eagles @ $25).
What is important to understand here is that Silver Eagles are selling 53 times more than Gold Eagles, but the value ratio is now 1/1. Not only has the historic 28 year sales ratio of 18/1 increased almost three times to 53/1, but investors are now purchasing dollar for dollar the same amount of Silver Eagles as they are Gold Eagles.
Of course both gold and silver will be excellent investments going forward, but investors are banking on higher percentage gains in silver. The market is realizing that Silver is the GO TO ASSET of the future.
No comments:
Post a Comment
Note: Only a member of this blog may post a comment.